If I want LinkedIn to help pipeline, I need to track who I’m reaching, not just how many people saw a post.
Here’s the short version:
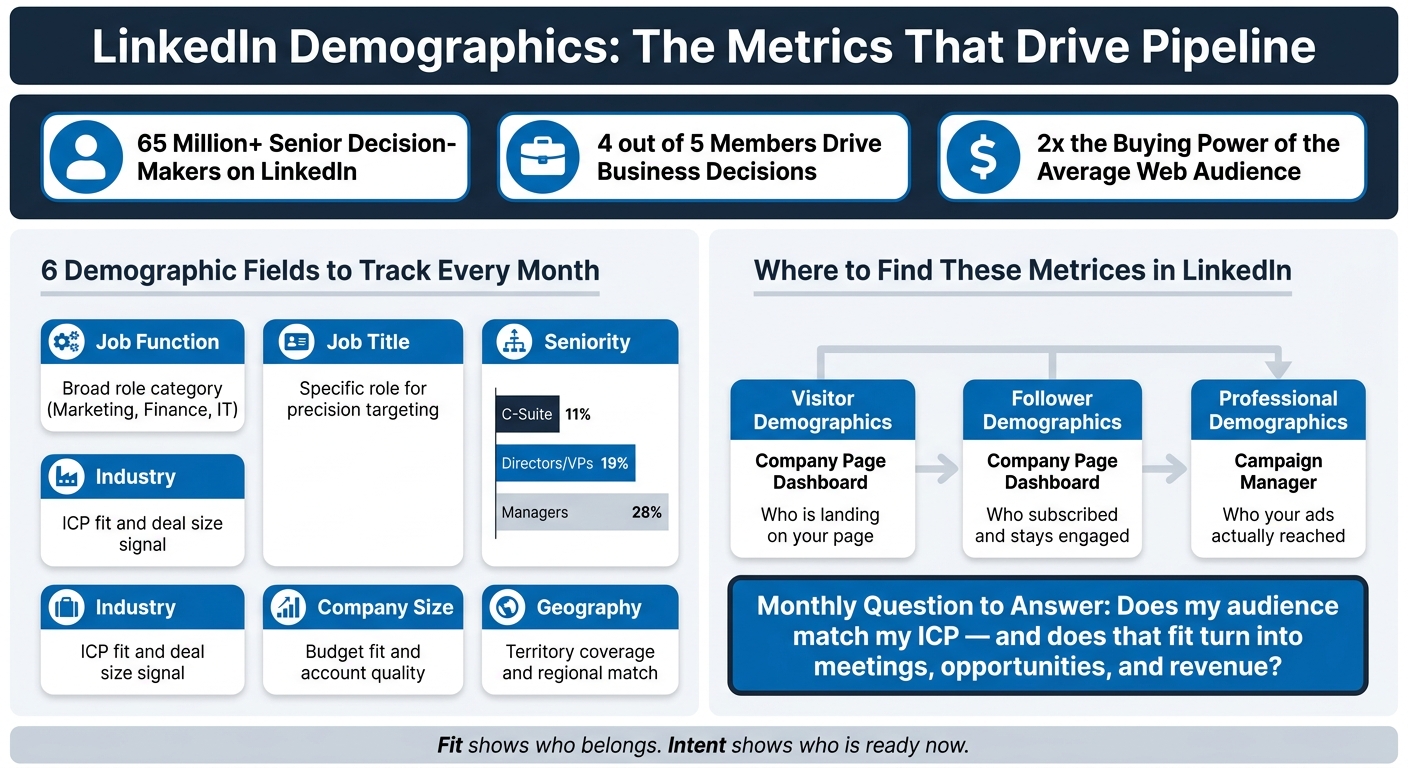
- I should watch six demographic fields: job function, job title, seniority, industry, company size, and geography
- I should review three LinkedIn reports each month: Visitor Demographics, Follower Demographics, and Professional Demographics in Campaign Manager
- I should use demographics to measure ICP fit
- I should use behavior, like profile views, comments, and engagement, to judge intent-led lead generation
- If clicks look fine but leads do not, the offer or landing page may be the issue
- If leads come in but opportunities stay low, targeting is often off
LinkedIn is not like most social platforms. It has over 65 million senior decision-makers and 10 million C-level executives. On top of that, 4 out of 5 members help drive business decisions. That means demographic data on LinkedIn can say a lot about whether my audience matches the accounts and roles I want.
The main point is simple: fit comes first. A page full of reactions from the wrong roles will not help revenue. But if I see visits and engagement from people like VPs, Directors, buyers in the right industry, and teams at the right company size, that is a much better sign.
| What I check | What it tells me | Why it matters |
|---|---|---|
| Job function, title, seniority | Buying role and authority | Shows if decision-makers are in the audience |
| Industry and company size | ICP match and deal size range | Helps judge account quality |
| Geography | Territory match | Shows if reach lines up with sales coverage |
| Visitor vs. follower data | Interest vs. subscription | Shows whether the right people stick around |
| Ad professional demographics | Who ads reached | Helps cut spend on low-fit segments |
| Intent signals | Who may buy now | Helps me prioritize outreach |
Bottom line: I’d use LinkedIn demographics to answer one question every month: does my audience match my ICP, and does that fit turn into meetings, opportunities, and revenue?
LinkedIn Demographic Reports: What to Track, Where to Find It & Why It Matters
The LinkedIn demographic metrics that matter most
Use LinkedIn demographics in three layers: buyer role, account fit, and channel reach. Fit tells you who your audience is. These metrics tell you whether that audience can help move revenue.
Job function, job title, and seniority
Look at these three metrics to gauge buying power, not just clicks or reactions.
Job function sorts members into broad roles like Marketing, Finance, and Information Technology. Job title gets more specific. Seniority shows how much decision power that person likely has. LinkedIn's audience data shows that C-Suite, Owners, and Partners make up 11% of the platform, Directors and VPs account for 19%, and Managers and Senior Managers represent 28%.
That matters because engagement from low-authority roles can make results look better than they are. Plenty of activity feels good. Pipeline impact is what counts.
Industry, company size, and geography
Industry and company size help you judge ICP fit, budget fit, and likely deal size.
Geography matters for territory coverage and regional targeting. That includes country, state, city, and metro.
Channel validation vs. account fit
Role and account data tell you who to target. Platform-wide data tells you whether LinkedIn can support that plan at scale.
LinkedIn's audience has 4 out of 5 members who drive business decisions at their organizations, and it has 2x the buying power of the average web audience. Use those numbers to check the channel itself, not to score single accounts. In plain English: platform-wide data helps you validate the channel, while account-level data helps you judge pipeline quality.
| Demographic Layer | What It Tells You | Primary Use |
|---|---|---|
| Job Function + Seniority | Authority level and buying role | Evaluating audience and targeting quality |
| Industry + Company Size | ICP fit and deal potential | ICP matching and ACV estimation |
| Geography | Territory coverage | Territory management |
| Platform-wide demographics | Channel viability | Market sizing and channel validation |
Once you know what to track, the next move is finding the reports that show each metric. Next, find these metrics inside Pages, Ads, and Sales Navigator.
sbb-itb-f8f3793
Where to find these metrics inside LinkedIn
LinkedIn puts the most useful B2B demographic data in three places, and each one answers a different question. Open the right report, and the numbers start to make sense. Open the wrong one, and it's easy to chase noise instead of fit.
Page visitor and follower demographics
Your Company Page admin dashboard breaks analytics into Visitors and Followers. At a glance, they seem close. They aren't. Each one shows a different stage of audience behavior.
Visitor demographics show who is landing on your page, including job function, seniority, industry, and geography. Follower demographics show who decided to subscribe and is more likely to keep seeing your organic content over time. Put those views side by side to see whether awareness is turning into followers.
If your visitors line up with your ICP but your followers don't, that's a signal. The right people may be finding you, but your content isn't turning that interest into a steady audience, even if you use a Taplio alternative for growth. LinkedIn stores Company Page analytics for up to 365 days, and anything older needs to be pulled through exports.
Ads professional demographics
Campaign Manager's Professional Demographics view shows ad delivery by job title, function, seniority, industry, and company size. This is the report to check when you want to know who your ads actually reached.
It also helps you find segments that click but never convert. If lower-fit functions or seniority levels are driving clicks without pipeline return, you're paying for traffic that doesn't move the deal forward. Even a small cut in wasted impressions can have a clear effect on spend.
Sales Navigator filters and outbound list quality
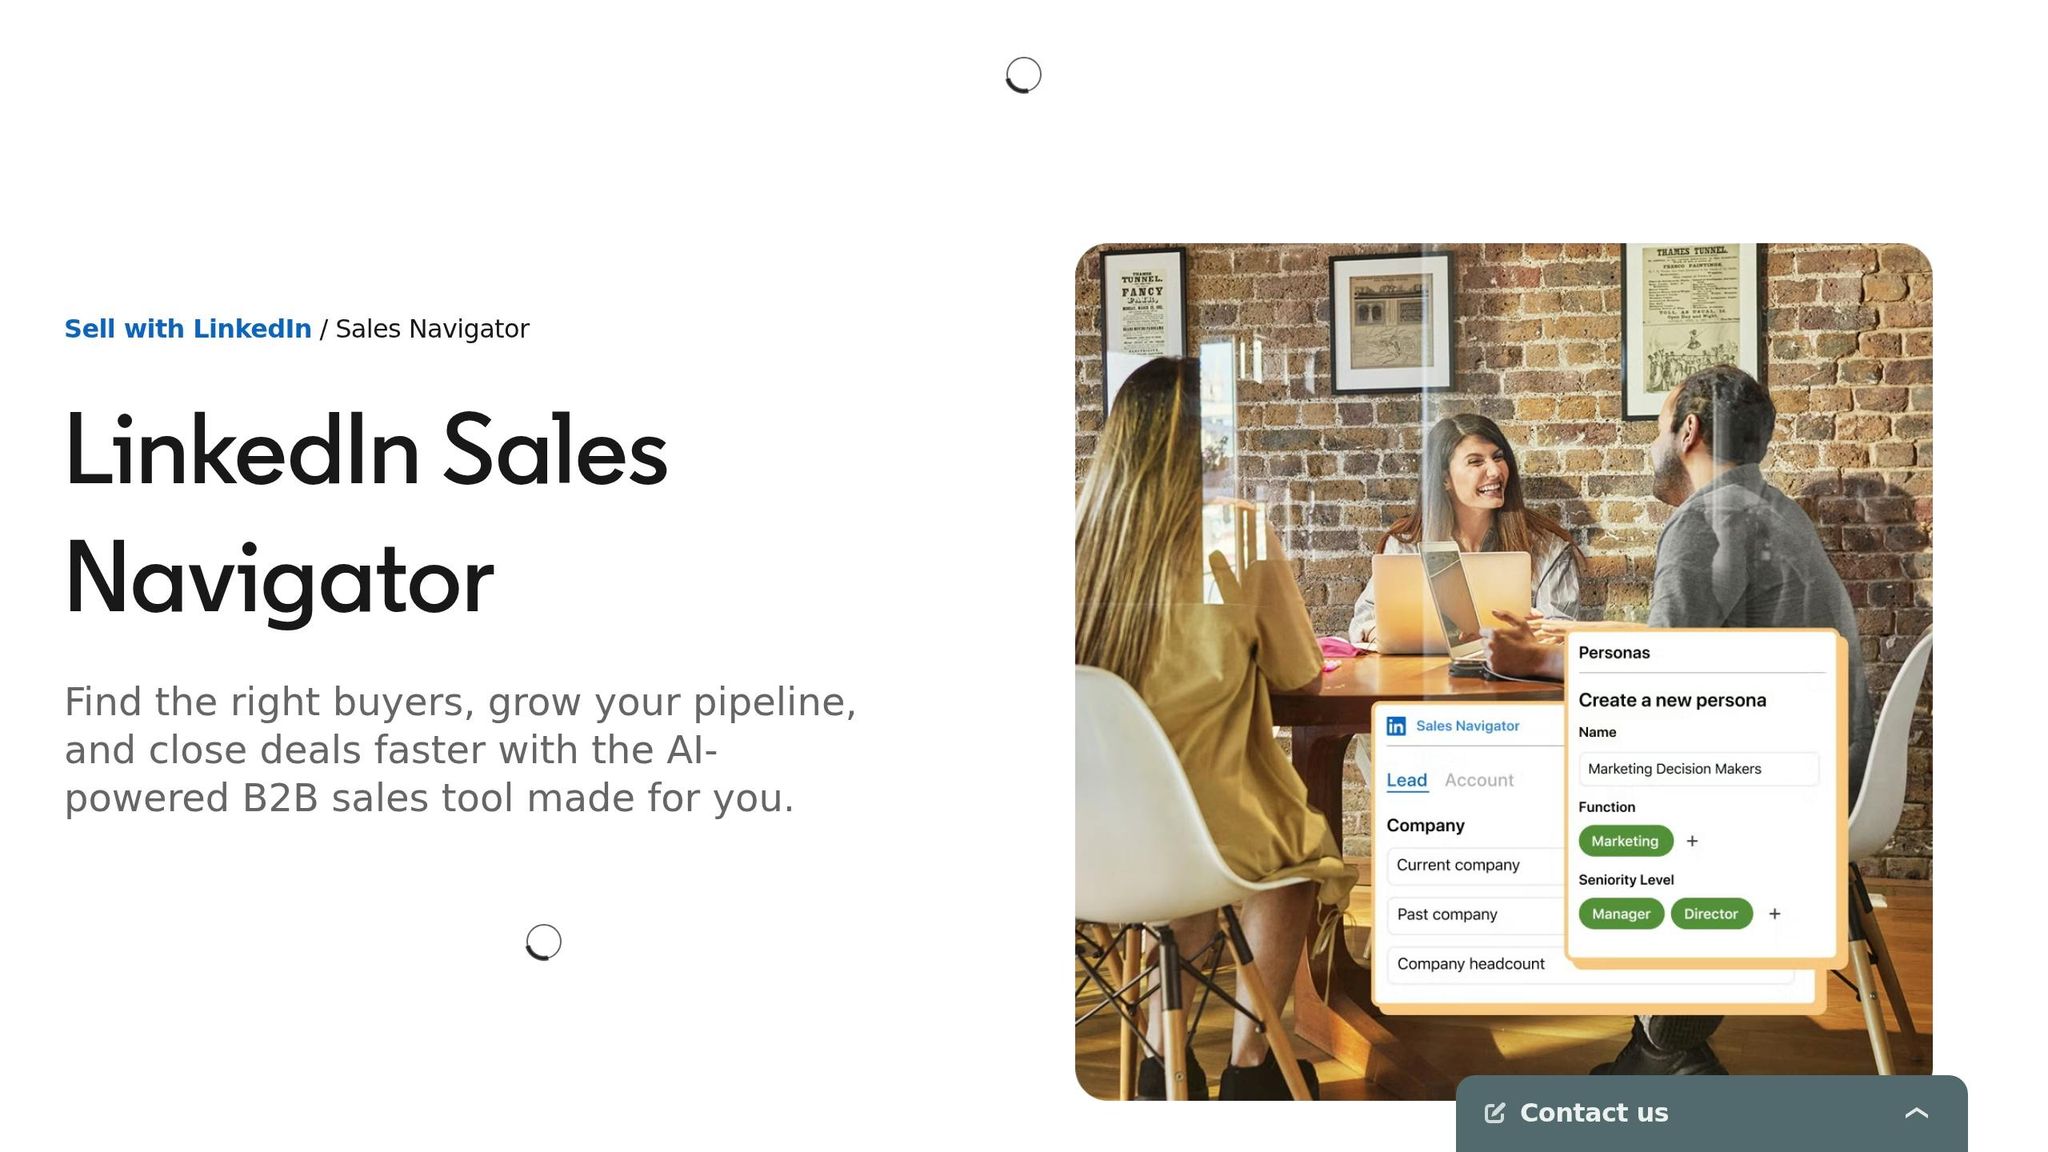
Sales Navigator turns demographic data into prospect lists. With filters for seniority, function, and geography, you can build outbound lists and check them against your ICP.
Keep junior roles out of decision-maker lists. A tighter seniority filter keeps outreach aimed at people who can actually buy.
| Reporting View | Where to Find It | Best Used For |
|---|---|---|
| Visitor Analytics | Company Page Dashboard | Spotting ICP drift in awareness traffic |
| Follower Analytics | Company Page Dashboard | Auditing organic audience composition |
| Professional Demographics | Campaign Manager | Cutting budget being wasted on non-ICP segments |
| Sales Navigator Filters | Advanced Search | Building high-fit outbound prospect lists |
Used together, these reports show where fit starts to slip before you change targeting or outbound work.
How to use LinkedIn demographics to improve pipeline decisions
Map your ICP to LinkedIn's demographic categories
Start with one fixed benchmark: your ICP.
Then map that ICP to LinkedIn's core fields: seniority, function, company size, industry, and location.
For example, that might look like Director or VP level, a matching job function, 51–500 employees, Tech/IT or Professional Services, and United States.
This step matters because it gives every report a clear point of comparison. Without that, it's easy to look at clicks, leads, or engagement and miss the bigger issue. If your reports don't line up with the ICP, the problem isn't volume. It's audience quality.
Diagnose weak pipeline by comparing audience, targeting, and opportunities
Once the ICP benchmark is clear, compare it with your audience, targeting, and opportunity data.
Inside Campaign Manager, you can compare Saved Audiences with the audiences that show up in your reports. That helps you see whether the people you're pulling in match the people you meant to target.
Here's the simple way to read it:
- If clicks aren't turning into leads, fix the offer or the landing page.
- If leads aren't turning into opportunities, fix targeting.
That split saves time. Otherwise, teams often tweak the wrong part of the funnel.
There's another pattern worth watching. If junior segments are driving activity but not opportunities, your budget and outreach effort are going to the wrong audience. On paper, the campaign may look busy. In the pipeline, it falls flat.
Combine demographics with intent signals to prioritize the right buyers
Fit tells you who matters. Intent tells you who matters now.
Profile views and post engagement can act as useful outreach triggers. Among those signals, put the most weight on meaningful comments. After that, look at shares, saves, and dwell time. A person who fits your ICP and has engaged lately should move ahead of a cold match.
For founder-led teams and small GTM groups, Postelix can help with this. It finds high-intent buyers, scores them against your ICP, drafts on-voice DMs, and surfaces high-value comment opportunities for approval.
Conclusion: The demographic reports worth reviewing every month
The six metrics that matter most are job function, job title, seniority, industry, company size, and geography. If those don't line up with your ICP, engagement won't turn into qualified pipeline. And those fields come through most clearly in three reports.
Review these three reports every month:
- Visitor Demographics
- Follower Demographics
- Campaign Manager's Professional Demographics
Then check whether that audience turns into pipeline.
A monthly review helps keep the data honest. Look at the prior month and connect demographic fit to meetings booked, opportunities created, and LinkedIn-influenced revenue.
The main question is simple: does fit convert? If your audience matches your ICP but opportunities are slow, fix the targeting or fix the path from attention to opportunity. Once the gap is clear, use intent signals to decide who to prioritize next.
Fit shows who belongs in your pipeline. Intent shows who is ready now. Review both every month so your decisions stay tied to buying behavior.
FAQs
How do I define ICP fit on LinkedIn?
Define your ICP fit by looking past vanity metrics like total user counts and focusing on traits tied to buying power and decision-making authority.
Start with your best customers. Then look for the patterns they share:
- Job functions
- Seniority levels
- Company sizes
- Industries
From there, sharpen that profile with LinkedIn data points like skills, company growth stage, and professional history.
Postelix can help you find prospects that match this fit and show real buying intent.
What’s a good monthly review process?
Focus on pipeline influence, not vanity metrics like impressions or follower counts.
Look at visitor and follower demographics to make sure they match your ICP. Pay close attention to job function, seniority, and company size. If the right people aren’t seeing your content, big engagement numbers don’t mean much.
Then stack your top-performing content formats next to conversion rates. The goal is simple: see which posts helped move contacts closer to opportunities. After that, check lead quality and cost per lead against your B2B targets for the month ahead.
Which intent signals matter most?
The most important LinkedIn intent signals are the ones that point to decision-makers and active engagement.
That means paying close attention to:
- Seniority
- Specific job titles
- Company size
- Live profile activity or engagement activity
Why do these matter so much? Because many LinkedIn members help shape business decisions and have strong buying power. When you zero in on these signals, it gets much easier to filter for your ICP instead of wasting time on people who were never a fit.
In plain English: everyday LinkedIn activity can become part of your B2B pipeline if you know what to look for.
Postelix helps you spot high-value comment opportunities and find people who are showing real buying intent.