LinkedIn advertising in 2026 is more expensive but still highly effective for B2B marketers. Here's what you need to know:
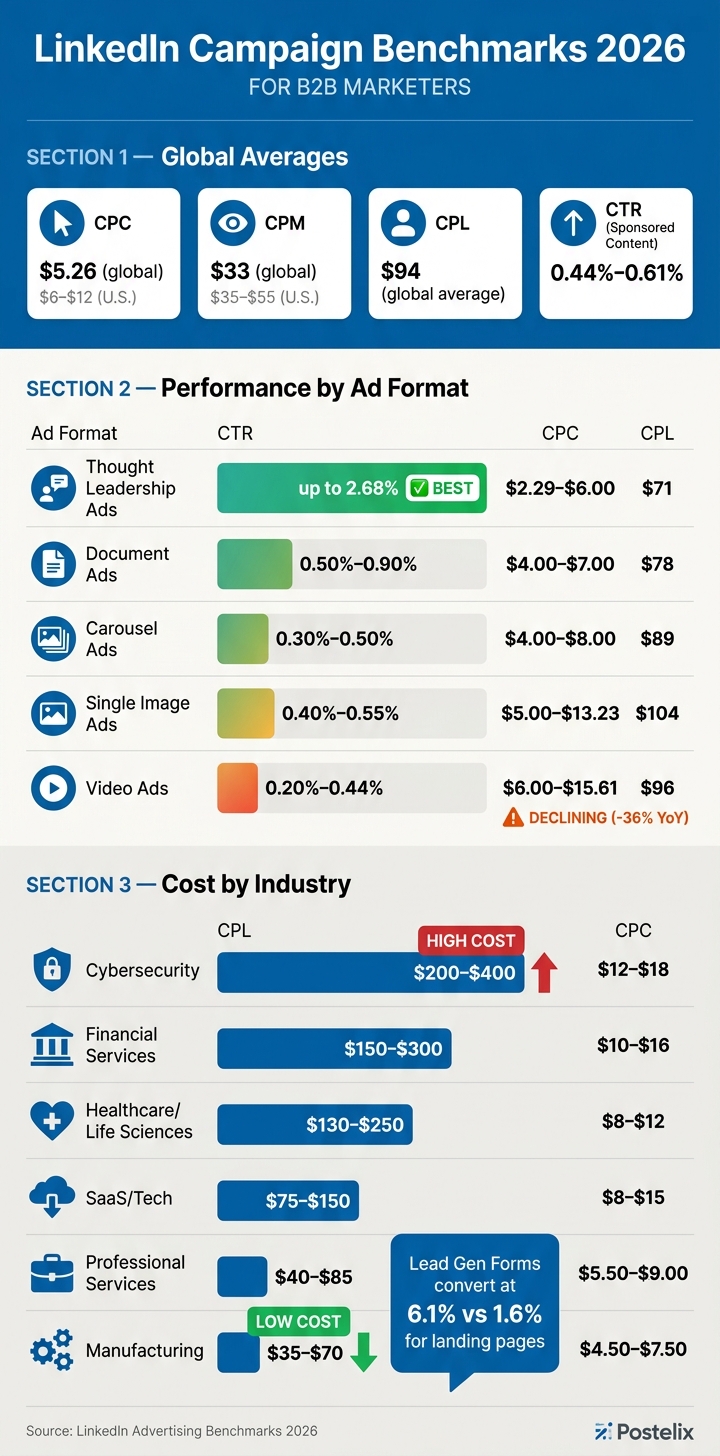
- Global Averages: CPC is $5.26, CPM is $33, and CPL is $94.
- Key Metrics: CTRs for Sponsored Content range from 0.44%–0.61%, with strong performance above 0.8%.
- Ad Formats: Thought Leadership Ads lead with a CTR of up to 2.68% and the lowest CPC at $2.29. Video Ads are underperforming due to market saturation.
- Industry Costs: Cybersecurity has the highest CPL ($200–$400), while Manufacturing is the most budget-friendly ($35–$70).
- Lead Gen Forms: These outperform external landing pages with a 6.1% conversion rate.
To improve results, focus on targeting, ad formats, and comparing LinkedIn growth tools to leverage industry-specific benchmarks. Thought Leadership Ads and Document Ads are the most efficient formats for driving engagement and reducing costs.
LinkedIn Ad Benchmarks by Industry & Format 2026
Cross-Industry LinkedIn Performance Metrics
Average Ranges for Key Metrics in 2026
Looking at LinkedIn ad performance across industries, the global average CPC in 2026 is $5.26, but U.S. advertisers often pay between $6 and $12 per click. These variations depend on factors like audience seniority and industry focus. Similarly, CPM rates reflect a premium for targeting professionals, with a global average of $33 compared to $35–$55 in U.S. campaigns.
An important trend is the rise in CPL from $87 in 2025 to $94 in 2026, largely due to the emphasis on targeting senior roles such as executives. This cost difference is especially noticeable in CPCs, which range from $3.18 for individual contributors to $14.85 for C-suite executives.
| Metric | Global Average | U.S. Average | Strong Performance |
|---|---|---|---|
| CPC | $5.26 | $6–$12 | Under $5 |
| CPM | $33 | $35–$55 | Under $28 |
| CTR | 0.44% | 0.40%–0.55% | Over 0.8% |
| CPL (Lead Gen) | $94 | $75–$200 | Under $80 |
| CVR (Lead Gen Form) | 8%–12% | 9%–13% | Over 13% |
As Calc4Marketers explains:
"A $4 CPC from a coordinator at a 10-person company is not more efficient than a $12 CPC from a VP at a 500-person company - if the VP is your ICP."
The key takeaway? A "low" CPC only matters if it’s attracting the right audience. These benchmarks provide a foundation for evaluating ad format performance in 2026.
Performance by Ad Format
The choice of ad format plays a major role in campaign results. Thought Leadership Ads (TLAs) are the standout performers in 2026, boasting a median CTR of 2.68% - six times higher than single-image ads. They also have the lowest median CPC at $2.29. Their success lies in their organic feel, which helps them avoid the "corporate ad blindness" common with traditional sponsored content.
Document Ads come in second, offering CTRs between 0.50% and 0.90% and an average CPL of $78. These ads hold users' attention longer, as audiences can engage with PDFs or whitepapers directly in their feed. On the other hand, Video Ads are experiencing a 36% year-over-year drop in views due to market saturation. Their CPCs reflect this challenge, ranging from $6 to $15.61.
| Ad Format | CTR | CPC | CPL |
|---|---|---|---|
| Thought Leadership Ads | 0.60%–2.68% | $2.29–$6.00 | $71 |
| Document Ads | 0.50%–0.90% | $4.00–$7.00 | $78 |
| Carousel Ads | 0.30%–0.50% | $4.00–$8.00 | $89 |
| Single Image Ads | 0.40%–0.55% | $5.00–$13.23 | $104 |
| Video Ads | 0.20%–0.44% | $6.00–$15.61 | $96 |
Text Ads, while offering low CPMs around $2, achieve a minimal CTR of just 0.025%, making them less effective for direct response campaigns.
sbb-itb-f8f3793
LinkedIn Benchmarks by Industry
CPC, CPL, and CTR by Industry
When it comes to LinkedIn advertising, costs can vary widely depending on the industry. For instance, Cybersecurity sits on the higher end of the spectrum, with cost-per-clicks (CPCs) ranging from $12 to $18 and cost-per-leads (CPLs) between $200 and $400. This reflects the high demand and limited supply of security professionals. Similarly, Financial Services sees CPCs of $10 to $16 and CPLs of $150 to $300.
These industry-specific numbers go beyond the general averages, offering a more detailed look at how LinkedIn costs shift across sectors.
In the SaaS and Tech space, CPCs fall between $8 and $15, while CPLs range from $75 to $150. Click-through rates (CTRs) hover between 0.44% and 0.65%, but inbox saturation keeps reply rates relatively low at 4.77%.
On the more affordable side, Manufacturing averages CPCs of $4.50 to $7.50 and CPLs of $35 to $70. Professional Services follows closely, with CPCs from $5.50 to $9.00 and CPLs between $40 and $85. These lower costs reflect less competition for these audiences, making them more budget-friendly options.
| Industry | Avg CPC | Avg CPL | CTR Range |
|---|---|---|---|
| Cybersecurity | $12–$18 | $200–$400 | 0.35%–0.50% |
| Financial Services | $10–$16 | $150–$300 | 0.40%–0.55% |
| Healthcare / Life Sciences | $8–$12 | $130–$250 | 0.40%–0.55% |
| SaaS / Tech | $8–$15 | $75–$150 | 0.44%–0.65% |
| Professional Services | $5.50–$9.00 | $40–$85 | 0.25%–0.45% |
| Manufacturing | $4.50–$7.50 | $35–$70 | 0.30%–0.50% |
As MetadataONE points out, "A $150 demo request lead that converts 30% to pipeline is more valuable than a $45 ebook lead that converts 3%". This helps explain why higher CPLs in industries like Financial Services and Enterprise SaaS are often justified by their strong return on investment.
These benchmarks serve as a useful reference for gauging how your campaigns compare to others in your field.
Below, At, and Above Average Performance Ranges
Using the benchmarks above, you can evaluate your LinkedIn campaigns more effectively. Across industries, a CTR above 0.90% is considered excellent, while anything under 0.30% suggests issues with your creative approach or audience targeting. Testing different post angles can help improve these metrics. For CPC, staying below $6.00 is a sign of strong performance, whereas costs above $15.00 might indicate inefficiencies in reaching the right audience.
For CPL, keeping costs under $150 is seen as excellent, while costs exceeding $400 often require a closer look at your offer, targeting, or landing page strategy. Interestingly, LinkedIn Lead Gen Forms often outperform external landing pages, with conversion rates of 10–18%, compared to just 2–6% for off-platform pages.
| Performance Level | CTR Range | CPC Range | CPL Range |
|---|---|---|---|
| Excellent | > 0.90% | < $6.00 | < $150 |
| Strong | 0.60%–0.90% | $6.00–$10.00 | $150–$250 |
| Average | 0.30%–0.60% | $10.00–$15.00 | $250–$400 |
| Below Average | < 0.30% | > $15.00 | > $400 |
Targeting by company size can also have a major impact. According to 42 Agency:
"The biggest CPL lever on LinkedIn is company size targeting. Excluding companies over 500 employees can reduce CPL by 60–70% for most B2B products."
How to Use Benchmarks in Your LinkedIn Campaigns
Comparing Your Results to Benchmarks
When you're evaluating your LinkedIn campaign performance, it's crucial to compare your results to benchmarks that align with your industry and company size. For instance, a 200-person SaaS company shouldn't measure itself against enterprise-level averages. The gap between a 15.2% and a 37.9% engagement rate target often comes down to company size, not necessarily the campaign's effectiveness.
To get accurate insights, filter benchmarks by industry and company size. Then, focus on median (P50), 75th percentile (P75), and 90th percentile (P90) thresholds. If you're at P75, you're outperforming 75% of similar companies, while P90 places you among the top 10%.
Use these benchmarks to identify areas where your performance deviates. For example:
- If your CPC is more than 20% above the industry average, it might be time to review your targeting and ad relevance.
- If your CPL exceeds benchmarks by 30% or more, consider testing LinkedIn Lead Gen Forms. These forms can bring down CPL by 25–40% compared to external landing pages.
These variances aren’t just numbers - they’re signals for where to refine your strategy.
Tactics to Improve Your Campaign Metrics
Fine-tuning your targeting can make a big difference. For instance, using specific job titles like "Treasury Director" instead of broader terms like "Finance Executive" can cut CPC by 25–47%. Similarly, filtering by company size remains one of the most effective ways to optimize CPL.
Ad format also matters. Document Ads perform exceptionally well, delivering 3.4x more dwell time and 2.6x more leads per dollar than static image ads in industries like B2B tech and professional services. In fact, native documents had an average engagement rate of 7.00% in 2026, making them the top-performing content format. Julia Holmqvist, Social Media Manager at Semrush, points out:
"Document posts perform well because they behave like 'free value' on a platform where people actively want to learn."
If your CTR is lagging, you can try Predictive Audiences to boost it by 19% or use AI-generated headline variants for an 8–12% lift. Timing your ad spend during business hours can also quadruple engagement compared to running ads during off-peak hours.
Using Postelix to Act on Benchmark Data
To put these strategies into action, Postelix offers tools that help you lower CPL and improve engagement by leveraging benchmark data. It pinpoints LinkedIn leads who are already showing buying intent, ensuring your budget isn’t wasted on cold prospects that increase CPL.
Postelix uses an interest graph to score prospects against your ideal customer profile. It identifies individuals based on the content and conversations they’re engaging with. This intent-driven approach aligns with account-based marketing (ABM) principles, which are known for reducing CPL on LinkedIn. Beyond targeting, Postelix can draft personalized posts and comments in your tone of voice. This is especially useful since personal profiles achieve an average engagement rate of 3.85%, far higher than company pages.
Key Takeaways and Planning for 2027
What the 2026 Benchmarks Tell Us
The data from 2026 highlights a critical insight: ad format and precise targeting matter more than budget size. For instance, native documents achieved an impressive 7.00% engagement rate, while broad targeting strategies continued to drive up costs unnecessarily. The average cost-per-click (CPC) across industries climbed to $6.50, marking an 8% increase from 2025, and the average cost-per-lead (CPL) rose to $94.
Another key shift? Lead Gen Forms have overtaken external landing pages as the go-to conversion tool. Lead Gen Forms now convert at 6.1%, compared to just 1.6% for off-platform pages. Meanwhile, video views saw a sharp 36% year-over-year decline, solidifying their role as a retargeting tool rather than a broad-reach strategy. These findings underscore the importance of prioritizing format effectiveness and refining targeting methods when setting goals for 2027.
"The only benchmark that truly matters is cost per pipeline dollar or cost per revenue dollar." - MetadataONE
How to Use 2026 Data to Plan 2027 Campaigns
Taking lessons from 2026's trends, planning for 2027 requires a sharp focus on setting realistic, data-driven targets. To maintain lead volume, B2B SaaS teams should plan for a 12–15% budget increase year-over-year. With cross-industry CPCs expected to reach $6.20–$6.40 by Q1 2027, sticking to last year's budget will likely result in diminished returns.
When setting goals, consider using tiered performance targets: P50 (median) as your baseline, P75 as above average, and P90 as top-tier performance. Account-based marketing (ABM) targeting, particularly for companies with 50–500 employees, can significantly improve results - boosting conversion rates by 2.7x and reducing CPL by 38%. Additionally, adopting AI-driven bid optimization, which now manages 72% of LinkedIn ad spend, can lower CPL by 14–22%.
"The accounts that out-perform next year will be the ones that combine ABM precision, Predictive Audiences seeded from closed-won customers, and Maximum Delivery bidding." - Digital Applied Report
LinkedIn Ads Cost You HOW MUCH? Benchmarks 2026 (CPC, CTR, CPM & CPL Explained)
FAQs
What benchmarks should I use for my industry and company size?
To set precise goals, it's essential to measure your LinkedIn performance against companies that share your industry and size. Relying on generic averages can lead to skewed insights since startups and large enterprises contribute very differently to overall data trends.
Instead, focus on percentiles: P50 (median) for a baseline of standard performance, P75 for top 25% performance, and P90 for the top 10%. Tools like Postelix can help you craft tailored content, find warm leads, and turn those insights into tangible pipeline growth.
When should I switch to Lead Gen Forms instead of a landing page?
When you're aiming for higher conversion rates - think 9–13% compared to the 2–4% typical for landing pages - LinkedIn Lead Gen Forms are the way to go. These forms streamline the process by auto-filling user information, which minimizes friction and keeps potential leads from dropping off.
However, if your offer involves more detailed or mid-funnel education that LinkedIn's format can't accommodate, sticking with a landing page might be the better option. For nurturing those leads, tools like Postelix can help you identify prospects and connect with them through personalized, natural-sounding interactions.
How do I lower CPL without losing lead quality?
If you're aiming to lower your cost per lead (CPL) without sacrificing lead quality, the key lies in refining your targeting and optimizing your campaigns.
Start by narrowing your audience. For example, focus on specific job titles like Treasury Director and exclude larger companies (those with 500+ employees) if they don't align with your goals. This approach helps ensure your ads are reaching the right people - those most likely to convert.
Another effective tactic? Use native Lead Gen Forms. These forms can reduce CPL by up to 25% because they tend to have higher conversion rates. Why? They allow users to submit their information without leaving the platform, making the process seamless.
Lastly, pay close attention to your ad creatives. Better engagement leads to better results. LinkedIn rewards ads that perform well with lower costs, so invest time in crafting visuals and copy that resonate with your audience. A strong creative can make all the difference.