If I only tracked impressions and likes on LinkedIn, I’d miss the numbers that help B2B teams get meetings and pipeline.
Here’s the short version: LinkedIn analytics matters when I connect page data, post data, profile activity, paid campaign results, website visits, and CRM outcomes. That’s how I can tell whether the right accounts are paying attention, which posts drive clicks and form fills, and which conversations turn into revenue.
A few points stand out right away:
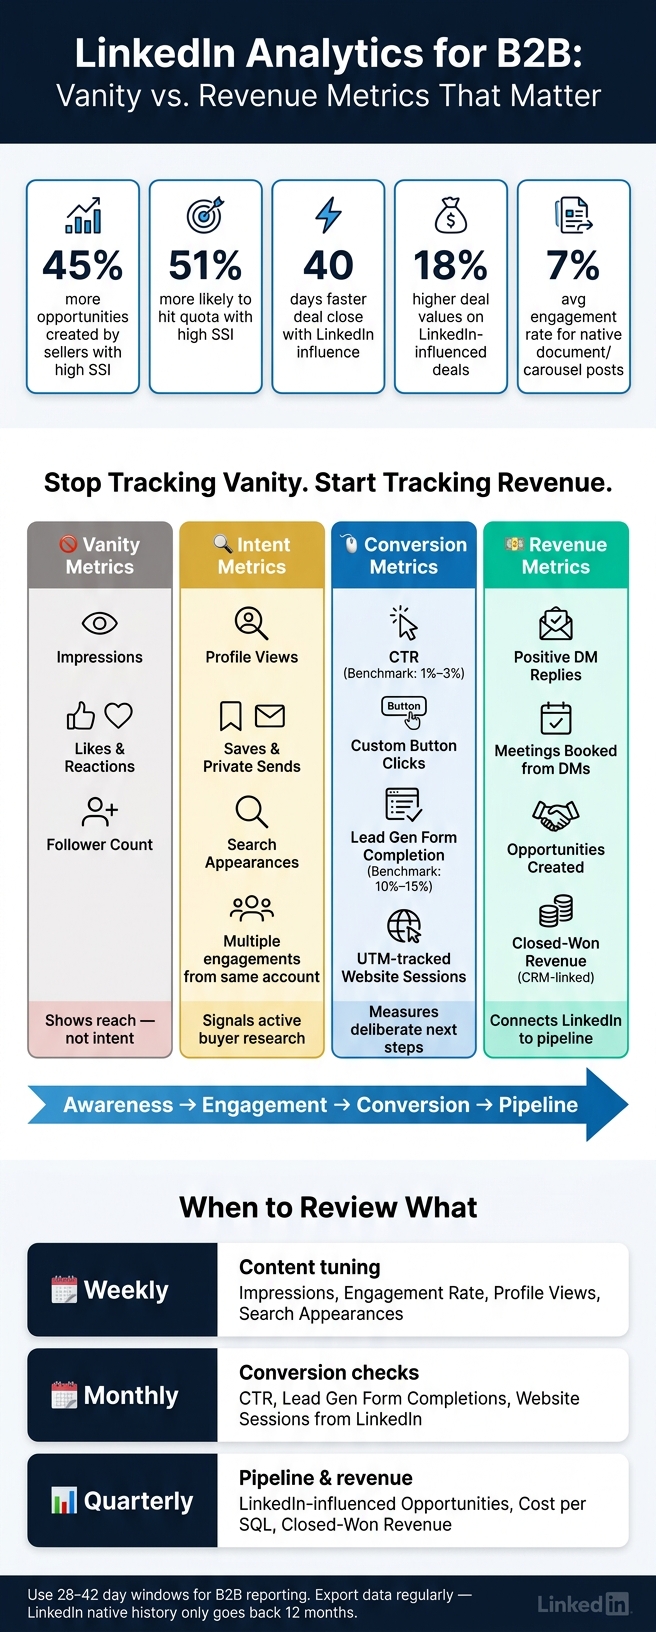
- Sellers with a high SSI create 45% more opportunities and are 51% more likely to hit quota
- LinkedIn-influenced deals close 40 days faster and have 18% higher deal values
- Native document posts often lead engagement at around 6.6% to 7.0%
- Personal profiles average about 3.85% engagement, vs. 2.1% for company pages
- Typical B2B LinkedIn conversion rates often land between 5% and 15%
- LinkedIn history is limited, so I need regular exports before older data disappears
What I’d focus on:
- Setup first: admin access, UTMs, Insight Tag, conversion events, naming rules
- Track the right metrics: audience fit, engagement rate, profile views, saves, sends, button clicks, form fills, meetings, and opportunities
- Use CRM data: LinkedIn alone won’t show the full path from comment or DM to pipeline
- Report by funnel stage: awareness, consideration, evaluation, pipeline, and revenue
- Review by cadence: weekly for content tuning, monthly for conversion checks, quarterly for pipeline and closed-won impact
A simple rule runs through the whole piece: vanity metrics tell me what got seen; intent and CRM metrics tell me what moved buyers.
That’s the lens I’d use for the rest of this guide.
LinkedIn Analytics for B2B: Vanity vs. Revenue Metrics That Matter
Ultimate Guide to LinkedIn Company Page Analytics for Business Growth
sbb-itb-f8f3793
Set up LinkedIn analytics so the data is usable
A lot of B2B teams skip setup and jump straight into dashboards. That's where reporting starts to fall apart. The goal here is simple: get data that's consistent, connected, and solid enough to tie LinkedIn activity back to pipeline over time.
With your data sources already defined, the next move is making sure you can trust what they're telling you.
Configure your company page, profile links, and campaign tracking
Start with access. Anyone who pulls or reviews LinkedIn data needs Analyst or Admin access on the Company Page. If they don't have it, they can't view or export native analytics.
Then tag every outbound link. UTM parameters are non-negotiable because they help GA4 attribute traffic to the right post, campaign, or content type. Use a shared UTM builder, even if it's just an approved spreadsheet, so everyone follows the same naming format. If one person uses q2-demo and another uses Q2_Demo, your reporting gets split.
Install the LinkedIn Insight Tag on your website to turn on conversion tracking, retargeting audiences, and demographic insights for site visitors. Without it, downstream conversion and retargeting reports are much harder to use.
Standardize Campaign Manager and conversion tracking
Inside Campaign Manager, keep naming conventions in line with your UTM rules so organic and paid data stay comparable. Do this now, and later you'll have a much easier time mapping performance to pipeline instead of stopping at clicks.
Set up conversion events that match the way your funnel actually works, including:
- Form completion
- Meeting booked
- Opportunity creation
A typical LinkedIn conversion rate for B2B sits between 5% and 15%. But that number means very little if your conversion events don't line up with real pipeline actions.
Also, wait at least 48 hours before locking in monthly reports. LinkedIn exports lag.
Create data hygiene rules and shared funnel definitions
Define - and document - what Lead, MQL, SQL, Opportunity, and Closed-Won mean for your team. Put those definitions somewhere easy to find. If people use the same words to mean different things, reporting gets messy fast.
It also helps to assign clear ownership for reporting across LinkedIn, web analytics, and CRM. When those three sources don't match, you want to know exactly where to look instead of wasting time guessing.
Export LinkedIn data on a regular schedule because native history only goes back 12 months. Once you've saved that history, the next section can connect these inputs to awareness, engagement, and pipeline.
Track the LinkedIn metrics that actually matter for B2B
Once your data is clean and tracking is set up, the next step is simple: know which numbers deserve your attention.
LinkedIn gives you a lot of metrics. Most of them look useful at first glance. But for B2B teams, only a small set ties back to pipeline. The rest can distract you.
Start at the top of the funnel with audience fit. Then work your way down to lead and pipeline signals.
Awareness, engagement, and audience-fit metrics
Think of impressions as reach, not buying intent. They tell you content was shown, not that it mattered.
To check whether the right people are finding you, look at unique reach, search appearances, and profile views. Those metrics show if people are not just seeing your content, but choosing to learn more.
For audience fit, skip the vanity numbers and go straight to follower demographics. Look at job titles, seniority levels, and industries. 500 followers inside your ICP are more useful than 10,000 that don't match. If the audience is off, the rest of the funnel usually breaks too.
For engagement, sort posts by engagement rate, not raw impressions, so you can spot what people care about. Some format data makes this pretty clear:
- Native document posts, or carousels, lead all formats with a 7% average engagement rate
- Personal profiles average 3.85%, compared with 2.1% for company pages
Comments often matter more than likes because they can lead to more distribution. And when comments get longer, that's often a sign of stronger interest. It's also smart to watch saves and private sends. Those actions usually mean someone wants to come back to the post later or share it with someone they trust.
Once you know the right people are seeing and engaging with your content, the next job is finding out whether that attention turns into leads.
Lead generation and conversion metrics
Engagement shows interest. Lead gen metrics show who's ready to take a step.
One of the clearest conversion signals on LinkedIn is lead form completion rate. But don't stop at total volume. Break completions down by job function, seniority, and industry. A hundred form fills from people outside your ICP can be less useful than twenty from the accounts you want.
Website sessions from LinkedIn matter too, especially when you track them with UTM parameters. That gives you a clean view of whether your content is driving traffic you can measure.
Also keep an eye on custom button clicks from your Company Page. These are some of the clearest intent signals you can get because they show a person choosing to take the next step.
And don't lump every conversion into one bucket. Track event sign-ups as their own conversion event. A form fill, a site visit, and an event registration can each point to a different stage of buyer intent.
Conversation and pipeline metrics from DMs and comments
The strongest LinkedIn signals show up when public engagement turns into direct conversation.
LinkedIn's native analytics can show reach, clicks, and engagement. What it can't show well is what happens next, like DM replies or meetings booked from those interactions.
That's why the pipeline metrics that matter most are positive DM replies, meetings booked from DMs, and opportunities created. You won't find those inside LinkedIn. You'll find them in your CRM.
To connect LinkedIn activity to pipeline, your team needs a clean process:
- Log DM outcomes
- Tag LinkedIn as the source
- Track which conversations turn into pipeline
If LinkedIn still gets missed in attribution, add a self-reported source field to your forms. That helps catch the influence your software may miss.
One signal worth watching closely: multiple people from the same target account engaging across different posts. That can point to buying-committee activity, which is often a strong sign of deal interest.
Tools like Postelix can help you see who is behind the engagement, draft human-reviewed DM openers, and track which conversations turn into meetings.
The table below maps each metric category to where you find it and what B2B goal it supports:
| Metric Category | Key Metrics | Where to Find It | B2B Goal |
|---|---|---|---|
| Awareness | Unique Reach, Search Appearances, Follower Demographics | Company Page / Visitor Analytics | Check whether the right ICP is seeing content |
| Engagement | Engagement Rate, Comments, Shares, Profile Views, Saves, Sends | Content Analytics / Visitor Analytics | Measure resonance and audience fit |
| Lead Gen | Form Completion Rate, UTM Sessions, Custom Button Clicks, Event Sign-Ups | Campaign Manager / Website Analytics | Capture intent and contact data |
| Pipeline | Positive DM Replies, Meetings Booked from DMs, Opportunities Created, Self-Reported Source | CRM + Postelix | Connect LinkedIn activity to revenue |
Use this framework to focus on the small set of metrics that lead to action, instead of the long list that simply fills up a dashboard.
Build a reporting framework that connects LinkedIn to pipeline
Once your core metrics are set, the next job is simple in theory and messy in practice: tie LinkedIn activity to the funnel and to the reports leadership already trusts.
That means bringing Company Page analytics, founder content data, Campaign Manager results, website analytics, and CRM outcomes into one reporting layer. If those numbers live in separate places, it gets hard to show how LinkedIn affects pipeline.
Map LinkedIn metrics to the B2B funnel and attribution model
Start with the funnel definitions from your setup section. Then assign each LinkedIn signal to one funnel stage and one attribution model.
At the awareness stage, track impressions, unique reach, and follower growth. At consideration, focus on engagement rate, profile views, comments, and reposts. At evaluation, the key signals are Lead Gen Form completions and high-intent link clicks. At the pipeline stage, the data shifts into your CRM: meetings booked, influenced opportunities, and closed-won revenue.
Use three attribution models:
- First-touch
- Multi-touch
- Self-reported
B2B teams now need account-level reporting, not just contact-level reporting. A deal often involves several people before it closes, so multi-touch models usually give the clearest view of LinkedIn’s role in pipeline.
Segment reporting by audience, content type, and motion
Blended reporting can blur what’s working. The most useful view breaks performance out by who posted, what format they used, and whether the motion was organic or paid.
Track founder posts and company-page posts separately. They behave differently, and reporting them as one bucket hides where top-of-funnel attention is coming from. It also makes it harder to show leadership how founder thought leadership affects the pipeline it touches.
The same goes for organic and paid. Track organic followers apart from followers gained through campaigns. Organic followers tend to show stronger long-term engagement retention. Also split out comments and reposts from likes, since they point to stronger audience response.
Numbers alone don’t tell the whole story. Qualitative intent signals matter too. Tools like Postelix can help surface those moments by identifying people showing real buying intent, drafting human-reviewed DM openers, and tracking which conversations turn into meetings.
Build dashboards leadership can use
A good dashboard should answer one decision question at a time. A simple way to do that is to organize reporting around three cadences.
Weekly, review operating metrics that help you tune content: impressions, engagement rate, search appearances, and profile views. This is where you spot format winners and timing patterns early.
Monthly, move to conversion metrics to see whether awareness is turning into pipeline action: CTR, Lead Gen Form completion rates, and website sessions from LinkedIn.
Quarterly, leadership needs the pipeline view: LinkedIn-influenced opportunities, cost per SQL, and closed-won revenue tied to LinkedIn touchpoints. This is also the right time to compare LinkedIn audience demographics, like seniority, industry, and company size, against CRM data to see whether pipeline quality matches your ICP.
The table below maps each funnel stage to the metrics that belong there:
| Funnel Stage | Key LinkedIn Metrics | Benchmark Range | System of Record |
|---|---|---|---|
| Awareness | Impressions, unique reach, follower growth | 800–2,000+ unique members reached per post | LinkedIn Page / Campaign Manager |
| Consideration | Engagement rate, profile views, comments, reposts | 3.85% average personal profiles; 2.1% average company pages | LinkedIn Native Analytics |
| Evaluation | Lead Gen Form completion, CTR, high-intent clicks | 10%–15% form completion; 1%–3% CTR | Campaign Manager / CRM |
| Pipeline | Meetings booked, SQLs, influenced opportunities | Business-specific | CRM |
| Revenue | Closed-won revenue, CAC | Business-specific | CRM / Finance |
Store exports outside LinkedIn, since native history only goes back 12 months.
Use these reports to decide what to scale, which audiences to target, and which engagement signals should go straight to sales.
Use LinkedIn analytics to make better GTM decisions
Improve content, cadence, and audience targeting
Once your reporting is set up, use it to make sharper GTM calls: what to post, who to reach, and what to change next.
A simple 10-minute weekly review is enough. Check impressions, engagement rate, profile views, and one post that didn’t do well. Then make one change for the next week. If a post underperforms, change one variable at a time - the hook, the topic, or the CTA (or testing different post angles) - never all three at once. That’s how you learn what actually moved the result.
There’s a pretty clear pattern here. Low impressions usually mean the hook didn’t land. High reach with low clicks usually means the offer or CTA wasn’t strong enough.
Format matters too. Native document carousels lead all formats, with an average engagement rate of 6.60%–7.00%. And Search Appearances can help you spot the buyer keywords people connect with, then work those terms back into your hooks.
At the same time, the feed has changed. Total impressions per post have dropped 63%–66% since 2023, while quality engagement has gone up 12%–39%. For B2B teams, that’s a useful tradeoff: fewer casual views, more attention from the people who matter.
The same signals that make content better can also show sellers who to contact next.
Turn warm engagement into seller actions
Run a quick weekly intent audit. Look for target accounts that viewed your profile or engaged more than once. Comments from Directors and VPs - even short ones - tend to mean more than broad reactions from low-fit audiences. A “great post” from the wrong person doesn’t help much. A short comment from the right buyer can be a strong next-step signal.
Focus on comment threads that create actual target-account engagement.
Postelix surfaces buying intent, highlights buyer comment threads, and drafts human-reviewed DMs in your voice.
Conclusion: Focus on metrics that move revenue
The core discipline is simple: separate the metrics that feel good from the ones that actually move revenue.
This final pass should split awareness signals from intent and revenue signals.
| Metric Type | Example Metrics | Why It Matters for B2B |
|---|---|---|
| Vanity | Impressions, Likes/Reactions, Follower Count | Shows raw reach or public approval, but doesn't confirm audience fit or buying intent. |
| Intent | Profile Views, Saves/Sends | Signals a buyer is actively researching; saves mean content was worth keeping. |
| Conversion | CTR, Custom Button Clicks | Measures whether content triggered a deliberate next step toward conversion. |
| Audience Fit | Seniority, Industry Demographics | Confirms engagement is coming from ICP roles, not low-fit noise. |
| Revenue | CRM-Linked Outcomes | Connects LinkedIn activity directly to revenue impact. |
Get the tracking right early, use UTM parameters the same way every time, and keep a CSV export for final reporting. Native dashboards often show rolling 30-day views, and those don’t always match lifetime totals. Review operating metrics every week, and use 28–42 day windows for reporting so you can better track the longer B2B consideration cycle. From there, use the data to sharpen targeting, tighten content, and turn warm engagement into actual conversations.
FAQs
How do I prove LinkedIn is driving pipeline?
Use attribution you can trust, and watch engagement over time. The goal isn’t just to count likes. It’s to see which touchpoints move people closer to a conversation.
Track things you can measure, such as:
- profile visits within 24–48 hours after posting
- lead magnet conversions
- conversations started from content
It also helps to collect self-reported attribution with a “How did you hear about us?” field. That gives you another way to connect content to results, especially when the path isn’t obvious in your analytics.
During the first 1–2 months, pay attention to early signals. Things like profile visits, replies, and conversion activity can tell you whether your posts are heading in the right direction. Pipeline impact from LinkedIn content usually takes 3–6 months of steady posting before it starts to show up clearly.
Which LinkedIn metrics matter most for B2B?
For B2B teams on LinkedIn, the metrics that matter most are engagement rate, impressions, reach, and click-through rate.
These numbers tell you a lot, fast:
- Engagement rate shows whether your content connects with people
- Impressions show how often your content appears on screen
- Reach shows how many people see it
- Click-through rate shows whether people take the next step
Follower quality and growth matter too, along with profile or page actions like visits and button clicks.
Put together, these metrics show three big things: how well your content works, whether you're reaching the right audience, and how much lead potential your LinkedIn presence has.
How often should I review LinkedIn analytics?
Review LinkedIn analytics weekly to track post performance, engagement, audience interactions, comments, profile views, and SSI movement. That way, you can spot strong content early and react fast when something shifts.
Then zoom out with a monthly review. Look at follower growth, audience demographics, and the content themes that are getting the best response.
A quarterly review is for the bigger picture: tie your LinkedIn activity to business KPIs, reset benchmarks, and check whether your overall strategy is still on track.