Analyzing LinkedIn metrics is key to improving your content strategy and achieving business goals. Here’s the essence:
- Focus on meaningful metrics: Prioritize engagement rate, lead signals, and KPIs tied to objectives like brand awareness or lead generation.
- Set clear goals: Match metrics to goals (e.g., impressions for awareness, CTR for leads) and establish baselines using past data.
- Organize and track data: Use LinkedIn Analytics to monitor post performance and audience demographics. Export data monthly to avoid losing insights.
- Identify trends: Look for patterns in engagement and audience behavior to refine content formats, hooks, and timing.
- Tie metrics to results: Use tools like UTM parameters to link LinkedIn activity to leads, pipeline growth, and business outcomes.
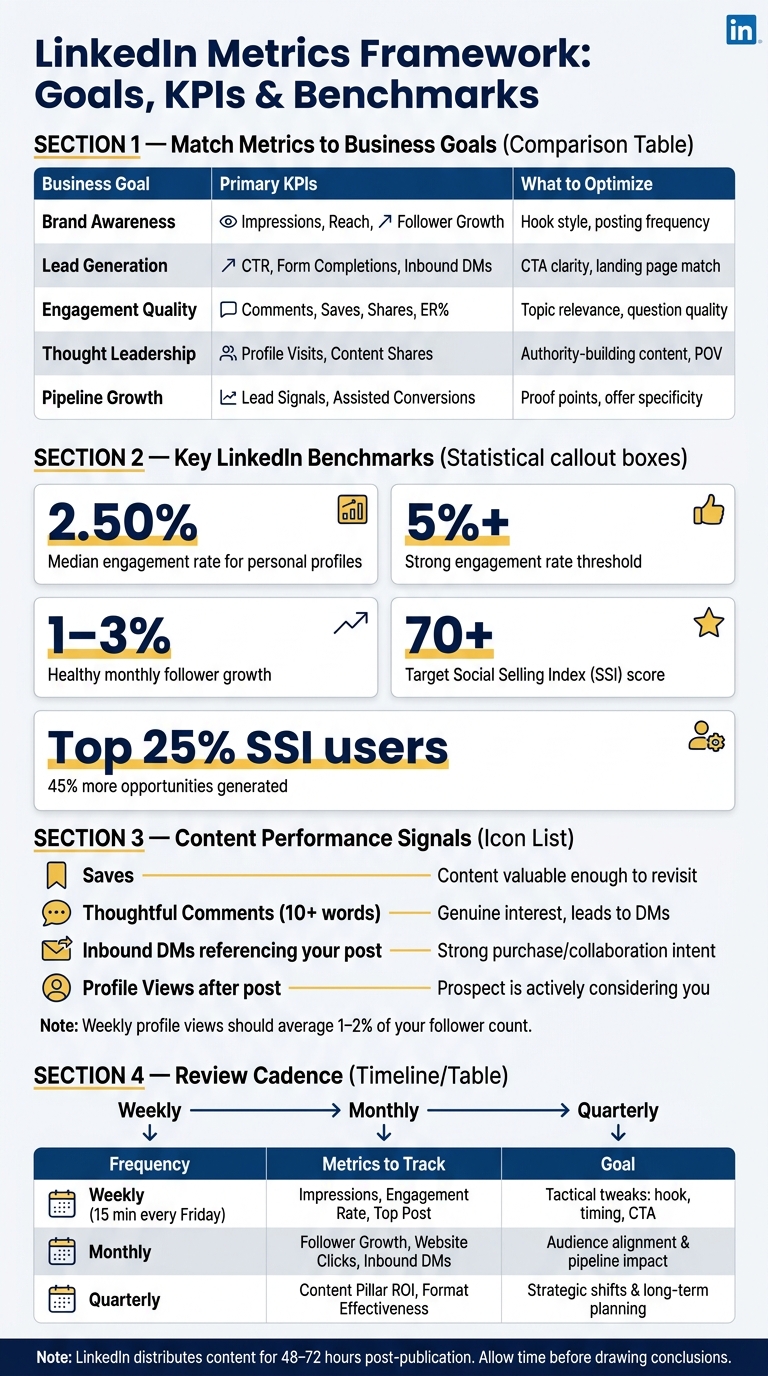
LinkedIn Metrics by Business Goal: KPIs, Benchmarks & Review Cadence
Linkedin Analytics DEEP DIVE (tutorial for beginners!)
sbb-itb-f8f3793
Setting Goals and Picking the Right Metrics
Start with a clear objective - without one, LinkedIn Analytics is just a sea of numbers with no direction.
Match Metrics to Business Goals
Each LinkedIn goal aligns with specific metrics. For brand awareness, focus on impressions and follower growth. If lead generation is your priority, keep an eye on click-through rate (CTR), LinkedIn Lead Gen Form completions, and inbound direct messages. One common mistake? Tracking metrics that don’t actually tie back to your goals.
"Measuring content performance means tracking the right signals for your goal, not chasing every metric LinkedIn puts in front of you." - Saad Mouaouine, MagicPost
To stay focused, group your metrics into three categories: Visibility, Engagement, and Business Impact. This approach helps you zero in on what truly matters and avoids distractions from irrelevant data.
Define Your Key Performance Indicators (KPIs)
Stick to two or three KPIs that directly connect to your objective:
| Business Goal | Primary KPIs | What to Optimize |
|---|---|---|
| Brand Awareness | Impressions, Reach, Follower Growth | Hook style, posting frequency |
| Lead Generation | CTR, Form Completions, Inbound DMs | CTA clarity, landing page match |
| Engagement Quality | Comments, Saves, Shares, ER% | Topic relevance, question quality |
| Thought Leadership | Profile Visits, Content Shares | Authority-building content, POV |
| Pipeline Growth | Lead Signals, Assisted Conversions | Proof points, offer specificity |
Don’t overlook the Social Selling Index (SSI). This score (ranging from 0–100) evaluates how well you're building a brand, networking, and engaging. Users in the top 25% reportedly generate 45% more opportunities. Aim for a score of 70 or higher, ensuring no component drops below 15.
Once you’ve nailed down your KPIs, measure your current performance to set meaningful targets.
Set Baselines and Targets
Knowing where you stand is crucial for turning metrics into actionable goals. Use data from the past 6–12 months to calculate your average engagement rate, impressions per post, and monthly follower growth.
"Tracking metrics without benchmarks is like checking your speed without knowing the limit. You see numbers going up or down, but you can't tell if you're ahead or behind." - Ivana Todorović, AuthoredUp
For context, the median engagement rate for personal LinkedIn profiles is 2.50%. A rate above 5% is considered strong. Monthly follower growth of 1–3% indicates steady progress, while 5–10% signals faster momentum. Use these benchmarks along with your historical data to set realistic yet challenging goals.
To refine your strategy, try a structured 4-week testing loop. Change just one variable at a time - like your hook, proof type, or format - to get clear, actionable insights.
Collecting and Organizing LinkedIn Data
Once you've defined your KPIs and established baselines, the next step is to gather raw data and organize it into a format that can drive actionable insights.
Using LinkedIn Analytics
For personal profiles, start by clicking the "Me" icon, selecting "View Profile", and scrolling down to the "Analytics" section. From there, click "Show all analytics" to access detailed metrics. If you're looking for post-specific data, you can click "View analytics" directly under any individual post.
For company pages, navigate to "Me", select your page under "Manage", and then click the "Analytics" tab. This opens up sub-sections like Visitors, Updates, Followers, Leads, and Competitors.
Both personal and company analytics allow you to filter data by date range - from 7 days to 365 days - and switch between metrics like Impressions and Engagements. This helps identify which posts are driving results. A particularly handy tool is the demographic filters. These filters let you break down your audience by job title, industry, seniority, company size, and location. It’s a great way to confirm if your content is resonating with the right audience - not just a large one.
"What gets measured gets managed." - HookTide Team
After reviewing the analytics, exporting the data ensures you can analyze it further.
Exporting and Structuring Data
LinkedIn makes exporting data simple. Use the export button (typically in the top-right corner of the Analytics tab) to download files in .XLSX or .CSV formats. For personal profiles, the "Combined post analytics" option consolidates all content types - like images, videos, polls, and articles - into one file. For company pages, you’ll need to export separate files for Visitors, Followers, and Content performance.
A crucial note: post-level demographic data is only available for the last 90 days. If you miss exporting data for a quarter, it’s gone for good. To avoid losing insights, export your data monthly and save it in a dated folder. When organizing your spreadsheet, group columns into four key categories: Content, Visitors, Followers, and Leads. This ensures every export fits into a consistent structure.
Tagging and Categorizing Content
Once your data is neatly structured, categorizing your content can help uncover performance patterns. Add two custom columns to your spreadsheet: Content Format (e.g., Video, Carousel, Text, Poll) and Content Theme (e.g., How-to, Case Study, Personal Story, Promotional). This allows you to filter and compare - like checking if your how-to carousels consistently outperform text-only posts.
While manual tagging works when you’re starting out, it can become overwhelming as your content volume grows. Tools like Postelix streamline this process by organizing posts by intent-based lead generation from the beginning. With consistent tagging, turning raw data into insights becomes a straightforward process, making it easier to refine your strategy instead of relying on guesswork.
Analyzing LinkedIn Metrics for Insights
Once your data is collected and neatly organized, the next step is to transform those numbers into actionable decisions. Metrics by themselves don’t tell the whole story - it’s the trends and patterns that reveal what’s truly effective.
Measuring Content Performance
A key metric to evaluate is engagement rate, which is calculated as (Likes + Comments + Shares) ÷ Impressions. On LinkedIn, an engagement rate between 2% and 5% is generally strong, while anything exceeding 10% indicates your post is resonating on a much larger scale. However, impressions alone can be misleading. A post with high visibility but little interaction holds less value compared to one that drives meaningful engagement.
"For example, a post with 5,000 impressions but no target leads underperforms compared to one with 800 impressions that generates three direct messages from qualified prospects." - MagicPost
To better understand what’s working, conduct a monthly "Top/Bottom" audit. Compare your three best-performing posts against your three weakest to uncover patterns in format, topic, or style. For example, one marketing agency discovered that posts with specific numbers in the opening line generated three times more comments. Additionally, they found that posting on Tuesday and Thursday mornings led to a 47% increase in engagement. These insights helped them boost average post interactions from 17 to 43 and significantly increase monthly inbound inquiries from 2–3 to 11–15. Testing different hooks or content formats can help you determine if strong impressions are translating into valuable interactions. You can also find your 3 post angles to ensure your content remains relevant to your target buyers.
Once you’ve assessed content performance, it’s time to dig deeper into your audience behavior.
Reading Audience Insights
Beyond performance metrics, it’s crucial to understand who is engaging with your content. Use LinkedIn’s demographic filters - like job title, industry, and seniority level - to confirm your audience aligns with your ideal customer profile. The goal is quality over quantity; growth in the wrong audience may dilute your messaging.
For instance, if you’re targeting VP-level buyers, check whether your follower demographics reflect decision-makers rather than entry-level professionals. Adjusting your content to include high-level insights or ROI-driven narratives can better capture the attention of senior leaders. Similarly, a sudden increase in followers from a specific region might indicate an opportunity to create localized content or tweak your posting schedule to align with that time zone.
Spotting Trends Over Time
While individual metrics offer snapshots, long-term trends provide a clearer picture of your strategy’s effectiveness. Tracking metrics like engagement rate, follower growth, and profile views week by week reveals whether your approach is gaining momentum or losing steam.
A steady follower growth rate of 1%–3% per month is typical, while growth above 5% suggests your content is reaching a broader audience. Additionally, if you notice a 2x–5x jump in profile views right after posting, it’s a strong indicator that your content sparked genuine interest. LinkedIn’s "Daily" vs. "Cumulative" toggle in the analytics dashboard can help you identify whether growth is consistent or driven by a one-off post. Consistent upward trends across multiple metrics are a reliable sign that your strategy is headed in the right direction. Use these insights to refine your content plan and drive even better results on LinkedIn.
Linking Metrics to Leads and Pipeline Growth
Turning data into action is all about connecting engagement to measurable business results. The real payoff comes when your LinkedIn activity translates into tangible outcomes - like demo requests, signed contracts, or new clients.
Tracking Leads From LinkedIn
To bridge the gap between LinkedIn engagement and website behavior, UTM parameters are your go-to tool. Add consistent tags to every link you share, such as utm_source=linkedin, utm_medium=social, and utm_campaign=your-campaign-name. Then, in Google Analytics 4, create a custom segment based on Session source = linkedin. This allows you to zero in on how LinkedIn visitors interact with your site.
Consistency is key: stick to lowercase UTM naming conventions (e.g., "linkedin") to avoid data discrepancies. Define clear lead signals, like direct messages referencing your posts, UTM-tagged form submissions, or demo requests made within seven days. These markers transform engagement into actionable pipeline data, directly tying your LinkedIn efforts to business growth.
Identifying Warm Leads
Engagement isn’t one-size-fits-all. Some signals are more telling than others. For instance:
- Saves indicate that someone found your content valuable enough to revisit.
- Thoughtful comments (10+ words that add depth to the conversation) show genuine interest and often lead to direct interactions.
- Inbound connection requests or DMs referencing your post are strong indicators of high interest.
Profile views also offer a wealth of insight. According to Ivana Todorović:
"Profile views are the bridge between content and action. Someone who views your profile after reading your post is considering you: as a connection, a client, a hire, a collaborator."
Your weekly profile views should average 1%–2% of your follower count. If a specific post causes a spike beyond this range, take note of the topic, format, and hook - it’s a clear sign of what resonates with your audience.
For more advanced tracking, tools like Postelix can help. Their intent-based lead discovery identifies 25–50 warm leads daily while monitoring competitor accounts and keywords. The Pipeline plan even includes a 24/7 Hot Lead Agent, so you can focus on engaging the right prospects without wading through endless notifications.
Estimating Business Impact
Measuring LinkedIn’s value to your business boils down to three essential metrics:
| Metric | What It Measures | Why It Matters |
|---|---|---|
| Cost Per Lead (CPL) | Total LinkedIn spend ÷ leads generated | Helps assess how efficiently you’re using your budget |
| Customer Acquisition Cost (CAC) | Total marketing and sales cost ÷ new customers | Shows the true cost of acquiring a client |
| Customer Lifetime Value (CLV) | Total revenue a customer generates over time | Determines if LinkedIn leads are worth pursuing |
To calculate CAC, divide your total LinkedIn investment - including time, tools, and paid promotion - by the number of clients you close. Then, compare this figure to your CLV. If your customer’s lifetime value far outweighs your acquisition cost, you’re on the right track. This approach ensures your LinkedIn strategy stays focused on meaningful business results, not just vanity metrics.
Turning Insights Into Improvements
Once you've analyzed your metrics, it's time to turn those insights into meaningful actions. Data by itself won't drive results - it’s how you act on it that makes the difference. The goal? Better posts and stronger engagement.
Refining Your Content Strategy
Use your data analysis to fine-tune your content strategy. Start by identifying which formats work best. For example, documents and carousels tend to perform well, generating 1.39x more reach and 2.6x more saves. These formats are perfect for creating informative posts. If a particular post doubles your average engagement, consider transforming it into a carousel or even expanding a popular comment into its own post.
Another useful tactic? Review your top three comments each week. These can spark fresh ideas for new content. As David Kim, a LinkedIn Analytics Specialist, puts it:
"If a metric can't change your next draft (hook, proof, timing, CTA), de‑prioritize it."
Want to test out new ideas without starting from scratch? Tools like Postelix can help. They generate AI-drafted posts in your voice, so you can quickly experiment with different hooks, formats, and topics while staying consistent.
Improving Your Engagement Workflow
Posting frequency is key. Profiles that post 4–5 times a week tend to see 28% more impressions per post compared to those posting just once a week. However, posting more than seven times weekly might overwhelm your audience.
Timing matters, too. The best window for LinkedIn activity is 8–10 AM, Tuesday through Thursday. Once your post is live, make the most of its first hour by replying to every comment. LinkedIn’s algorithm views these replies as additional engagement, which can help extend your post’s reach.
Here’s another tip: leverage employee advocacy. A quick Slack message or email to your team, asking them to engage with your post during its first hour, can significantly boost its visibility.
Consistently refining your engagement tactics will feed into a stronger, more effective strategy over time.
Building a Regular Review Process
Regular reviews - weekly, monthly, and quarterly - are essential for keeping your strategy sharp. Here’s a breakdown of what to track and why:
| Review Frequency | Key Metrics to Track | Goal |
|---|---|---|
| Weekly | Impressions, Engagement Rate, Top Post | Tactical tweaks: adjust hook, timing, or CTA |
| Monthly | Follower Growth, Website Clicks, Inbound DMs | Ensure audience alignment and measure pipeline impact |
| Quarterly | Content Pillar ROI, Format Effectiveness | Make strategic shifts and plan for the long term |
Your weekly review doesn’t have to take long - just 15 minutes every Friday. Sort your posts by engagement and save rates, then identify your weakest post. Adjust one variable - like the hook, timing, or CTA - to see what drives better results.
These regular check-ins also help you refine the KPIs and benchmarks you set earlier, keeping your strategy aligned with your business goals. For broader trend analysis, use quarterly reviews to assess data over longer periods. Keep in mind that LinkedIn’s algorithm continues distributing content for 48–72 hours after publication, so give your posts time to gain traction before drawing conclusions.
Conclusion: Getting Better Results With LinkedIn Metrics
LinkedIn metrics aren't just numbers - they're tools for smarter posting. By shifting from guesswork to a data-driven approach, you can turn those metrics into actionable strategies that boost results.
Here’s the formula: set clear goals, organize your data, analyze performance, and connect your content to real business outcomes. As Richard van der Blom, a LinkedIn Algorithm Researcher, explains:
"The LinkedIn algorithm rewards conversation, not broadcasting. The more genuine replies your post generates, the wider it travels."
It’s not always about flashy numbers. Metrics like saves, profile views per post, and inbound DMs often reveal more about your business impact than raw impressions or likes. These high-intent signals are what separate a strategy that merely looks good from one that actually drives results. Tools such as Postelix can make this process even easier by helping you draft posts, identify warm leads, and manage your engagement - all tailored specifically for LinkedIn.
As the HookTide Team wisely says, "what gets measured gets managed." By dedicating just 15 minutes a week to reviewing your metrics, you can uncover patterns and make small adjustments that lead to big improvements over time. With a consistent, informed approach, you can build a LinkedIn presence that truly delivers.
FAQs
Which LinkedIn metrics matter most for my goal?
The LinkedIn metrics that matter most depend on what you're aiming to achieve. Here are some key ones to keep an eye on:
- Engagement rate: This measures how actively people interact with your content. It's calculated by dividing the total reactions, comments, shares, and saves by the number of impressions.
- Profile views per post: A handy metric for lead generation, showing how your posts drive traffic to your profile.
- Click-through rate (CTR): Tracks how many people clicked on a link in your post, providing insight into how well your content drives action.
- Saves: Indicates how useful people find your content, as they save it for later reference.
- Lead signals: Includes mentions, demo requests, or other direct actions that show interest in your services or products.
Monitoring these metrics gives you a clearer picture of how your content is performing and helps you adjust your strategy to achieve better outcomes.
How do I set realistic baselines and targets on LinkedIn?
To establish practical baselines and targets, start by focusing on metrics that directly tie into your objectives - like engagement rates or follower growth. Compare your current performance to industry standards to get a sense of where you stand. This helps you pinpoint your starting point more accurately. From there, set small, attainable goals, such as gradually increasing engagement by a few percentage points over time. Keep an eye on your progress regularly and tweak your strategy as needed to make sure you're staying on track with your goals.
How can I prove LinkedIn posts drive leads and revenue?
To demonstrate that LinkedIn posts contribute to leads and revenue, focus on tracking a few key metrics:
- Profile views: An increase in profile visits after posting can indicate your content is grabbing attention.
- Direct messages: Look for messages referencing your posts, as they often signal interest or potential leads.
- Form submissions with UTM tags: These help you trace specific posts driving traffic to forms.
- Qualified demo requests within 7 days: This metric connects your posts to tangible business opportunities.
- Click-through rates (CTR): Monitor how many users engage with links in your posts.
Review these metrics regularly to spot patterns. For instance, if a certain post leads to a noticeable spike in profile views or demo requests, it’s a clear sign your content is influencing lead generation and revenue growth.